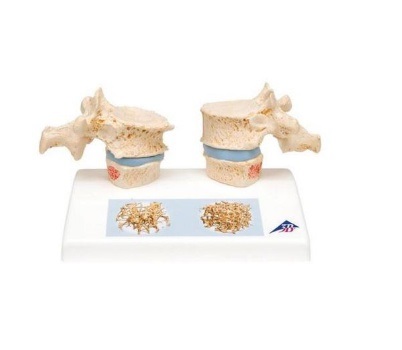
¿À´Ã º» »óÇ° (0)
    no
    show
    °ßÀû¹®ÀÇ
    ½Ç½Ã°£°ßÀû
    ±â¼úÀÚ·á½Ç
    °øÁö»çÇ×
    Áú¹®°ú ´äº¯
    °í°´¼¾ÅÍ
    T.032-579-1191
    ¿ù - ±Ý : 09:00 ~ 18:00
    Á¡½É : 12:00 ~ 13:00
    Åä, ÀÏ, °øÈÞÀÏ ÈÞ¹«
    °í°´¼¾ÅÍ ¿¬°áÀÌ Àß µÇÁö¾ÊÀ»½Ã
    Q&A °Ô½ÃÆÇÀ» ÀÌ¿ëÇØÁÖ¼¼¿ä.

    °ñ´Ù°øÁõ ¸ðÇü, A95
    Osteoporosis Model
    ÆǸŰ¡°Ý °¡°Ý¹®ÀÇ
    ¿ø»êÁö EU
    ºê·£µå 3B Scientific
    Á¦Ç°ÄÚµå A95
    ÁÖ¹®¼ö·®
    »ó¼¼¼³¸í »óÇ°Èıâ(0) »óÇ°¹®ÀÇ(0) ±³È¯ ¹× ¹ÝÇ°/¹è¼Û/°áÁ¦


    4.JPG


    1.jpg


    A. Ư ¡ (Features)


    - Á¤»ó ÈäÃß¿Í °ñ´Ù°øÁõÀÌ ÀÖ´Â ÈäÃ߸¦ ºñ±³


    - 11¹ø°ú 12¹ø ÈäÃß°¡ Ç¥Çö


    - °ñ´Ù°øÁõÀÇ ¼øÂ÷ÀûÀÎ ÁøÇà°ú Á¼¾ÆÁø Ãß°£ÆÇÀ» º¸¿©ÁÜ


    - Áß¾Ó Àý¹ÝÀÌ ÀÚ¼®À¸·Î Å»ºÎÂø °¡´É


    - ÃßüÀÇ °ñÀý Ç¥Çö


    - »ÀÀÇ ÅðÇ༺ º¯È­ Ç¥Çö


    - °ñ»ý°ËÀ» ÅëÇØ ¾ò¾îÁø 3D micro CT »óÀÇ À̹ÌÁö ½ºÅĵ忡 ºÎÂø


    - º´º¯ÀÌ ÀÖ´Â »À¿Í Á¤»ó »ÀÀÇ °ñ¹Ðµµ ºñ±³


    B. ±Ô °Ý (Specifications)


    14 x 9 x 10 cm; 0.2 kg


    Impressive didactic model for comparing osteoporotic and normal thoracic vertebrae. Ideal for medical studies and patient consultation. The 11th and 12th thoracic vertebrae are shown.


    Reproductions of sequential osteoporotic thoracic vertebrae with narrower intervertebral disc are located on the left of the stand. The upper vertebra is divided in the middle. The magnetically attached vertebral half can be removed easily to show the cut surfaces. This allows clear visualization of the fractured upper part of the vertebral body caused by sintering, i.e. collapse of the bony substance in the course and as a result of osteoporosis. Degenerative changes in the bone, manifested as osteophytes, are also identifiable.


    For comparison, reproductions of two corresponding healthy vertebrae with intervertebral disc are provided on the right side. One half of the upper vertebral body is magnetically attached and can be removed.


    A detail illustration on the base depicts two 3D micro CT images obtained from bone biopsies. These illustrate the microacrchitecture of the osteoporotic bone, which has a lower bone density compared to healthy bone.


    * °è»ê¼­ ¹ßÇà ¿äû½Ã ¹ßÇà °¡´ÉÇÕ´Ï´Ù . (Ä«µå ±¸ÀԽà Á¦¿Ü ) * ¹«´Ü º¹À縦 ±ÝÇÕ´Ï´Ù .
    »óÇ°Á¤º¸°í½Ã
    Á¦Ç°¸í °ñ´Ù°øÁõ ¸ðÇü, A95
    ÆǸŰ¡°Ý °¡°Ý¹®ÀÇ
    ºê·£µå 3B Scientific
    ¿ø»êÁö EU
    °ü·Ã»óÇ°
        
    »ó¼¼¼³¸í »óÇ°Èıâ(0) »óÇ°¹®ÀÇ(0) ±³È¯ ¹× ¹ÝÇ°/¹è¼Û/°áÁ¦
    ¹øÈ£ Á¦¸ñ À̸§ º°Á¡ ³¯Â¥
    ¾ÆÁ÷ ÀÛ¼ºµÈ »óÇ°ÆòÀÌ ¾ø½À´Ï´Ù.
     
    »ó¼¼¼³¸í »óÇ°Èıâ(0) »óÇ°¹®ÀÇ(0) ±³È¯ ¹× ¹ÝÇ°/¹è¼Û/°áÁ¦
    ¹øÈ£ Á¦¸ñ À̸§ ³¯Â¥
    ÀÛ¼ºµÈ »óÇ°¹®ÀÇ°¡ ¾ø½À´Ï´Ù.
      »óÇ°¹®ÀÇÇϱâ
    »ó¼¼¼³¸í »óÇ°Èıâ(0) »óÇ°¹®ÀÇ(0) ±³È¯ ¹× ¹ÝÇ°/¹è¼Û/°áÁ¦
    ¹ÝÇ°±³È¯
    ±¸ÀÔÁ¦Ç°ÀÇ ÀÌ»óÀÌ ÀÖÀ» °æ¿ì
    - ±¸ÀÔÈÄ 7ÀÏ À̳»¿¡ µ¿ÀÏÁ¦Ç°À¸·Î ±³È¯ °¡´ÉÇÏ¸ç ¿î¼Ûºñ´Â ÆǸÅÀÚ ºÎ´ãÀÔ´Ï´Ù.
    - ´Ù¸¥ Á¦Ç°À¸·Î ±³È¯, ¶Ç´Â ÀÌ»óÀÌ ¾ø´Â Á¦Ç°°ú ÇÔ²² ±³È¯À» ¿øÇÏ½Ç °æ¿ì ±¸¸ÅÀÚ²²¼­ ¿î¼Ûºñ¸¦ ºÎ´ãÇÕ´Ï´Ù.

    ±¸ÀÔÁ¦Ç°ÀÇ ÀÌ»óÀÌ ÀÖÀ» °æ¿ì (»ö»ó,»çÀÌÁî,´Ù¸¥»óÇ°±³È¯)
    - ±¸ÀÔÈÄ 7ÀÏÀ̳» ±³È¯ °¡´ÉÇÏ¸ç ±¸¸ÅÀÚ²²¼­ ¿î¼Ûºñ¸¦ ºÎ´ãÇÕ´Ï´Ù.

    !! ÁÖÀÇ»çÇ×
    ºñ´ÒÆ÷Àå ¹× TagÀÇ Æó±â ¶Ç´Â ÈÑ¼Õ µîÀ¸·Î »óÇ° °¡Ä¡°¡ ¸ê½ÇµÈ °æ¿ì¿¡´Â Á¦ÇÑ.
    ¹ÝÇ°½Ã¿¡ ÇØ´ç »çÀºÇ°ÀÌ ÀÖÀ» °æ¿ì °°ÀÌ º¸³»ÁÖ¼Å¾ß ÇÕ´Ï´Ù.
    ¹è¼Û¾È³»
    °áÁ¦ÈÄ 3~7ÀÏ À̳»¿¡ »óÇ°À» ¹Þ¾Æ º¸½Ç ¼ö ÀÖ½À´Ï´Ù.
    ±¹³» ÃÖ´ëÀÇ ¹°·ù»ç ¿»·Î¿ìĸÅù踦 ÅëÇÏ¿© ½Å¼ÓÇÏ°í ¾ÈÀüÇÏ°Ô ¹è¼ÛµË´Ï´Ù.
    ¸ðµç Á¦Ç°Àº ÂøºÒ ¹ß¼ÛµË´Ï´Ù. ´Ü 30¸¸¿ø ÀÌ»ó ±¸ÀԽà ¹«·á¹è¼ÛÀÔ´Ï´Ù.
    (Á¦ÁÖµµ¸¦ Æ÷ÇÔÇÑ µµ¼­,»ê°£Áö¿ªÀº Ç×°ø·á ¶Ç´Â µµ¼±·á°¡ Ãß°¡µË´Ï´Ù.)
    °áÁ¦¾È³»
    °áÁ¦¹æ¹ýÀº ½Å¿ëÄ«µå, ±¹¹Î/BC(ISP), ¹«ÅëÀåÀÔ±Ý, Àû¸³±ÝÀÌ ÀÖ½À´Ï´Ù.
    Á¤»óÀûÀÌÁö ¸øÇÑ °áÁ¦·Î ÀÎÇÑ ÁÖ¹®À¸·Î ÆÇ´ÜµÉ ¶§´Â ÀÓÀÇ·Î ¹è¼ÛÀÌ º¸·ùµÇ°Å³ª,ÁÖ¹®ÀÌ Ãë¼ÒµÉ ¼ö ÀÖ½À´Ï´Ù.
    »óÈ£ : ¿¡À̺ñÅ¥     ÁÖ¼Ò : ÀÎõ °è¾ç±¸ ÀÛÀüµ¿ 859-11     ´ëÇ¥ÀÚ : ÇãÁ¾¼ø     »ç¾÷ÀÚµî·Ï¹øÈ£ : 573-06-02527 (Á¤º¸È®ÀÎ)
    Åë½ÅÆǸž÷½Å°í : Á¦2022-ÀÎõ°è¾ç-1264È£     ºÎ°¡Åë½Å»ç¾÷ÀÚ¹øÈ£ :      °³ÀÎÁ¤º¸°ü¸®Ã¥ÀÓÀÚ : ±èÈñÁ¤     °³ÀÎÁ¤º¸º¸È£±â°£ : ȸ¿øÅ»Åð½Ã
    È£½ºÆü­ºñ½ºÁ¦°ø¾÷ü : µðÁöÀ¥